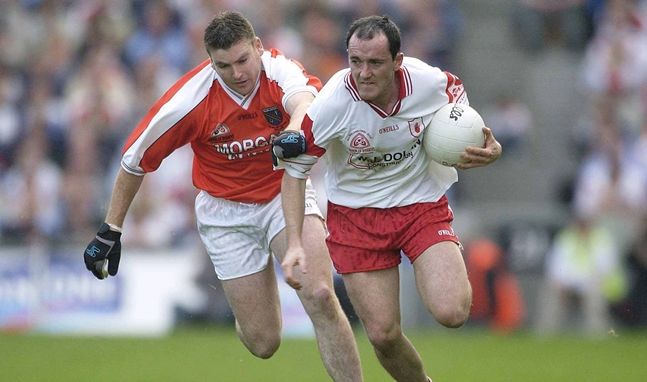
The first time I came across the notion of taking individual possession statistics on players was after I read Mickey Harte’s account of Tyrone’s 2003 All-Ireland football success, “Kicking Down Heaven’s Door”.
Most memorably, it noted that Brian Dooher was getting on 37 possessions per game from wing forward, twice the inter-county average.
With that, I started to play with a basic system based on possessions, scores and turnovers. It wasn’t long, however, before I realised that it was all too simple a system.
After analysing a team I was managing, in a drawn minor final, something appeared just not right. Three players came in with identical figures – 17 possessions, no scores and three turnovers.
I understood playing in the defence well enough to know that counting what the half forward had done on the ball was equally, if not more, important than what the half back had done on the ball. So I knew that these figures were only looking at half of the picture anyway.
One half back’s man had barely seen the ball faced with top-notch man-marking, while the other’s was the opposition’s key attacker. Fair and logical assessment wasn’t going to cast an even judgement on two defenders based purely on their own possession stats.
What jumped out as being completely out of kilter, however, was the fact that our midfielder, who had been at the crux of most of our attacks, had identical possession readings to the others. It simply didn’t add up.
So, I had a re-think, re-shuffled how I applied the system, and I came back with a new system. Turnovers were re-bracketed and turned into regular turnovers and ones where the player was attempting a line-break.
Possessions that didn’t end up as scores or turnovers were re-bracketed into:
- Neutral plays (nothing noteworthy or contributing to a line-break)
- Mildly positive plays (more that “Neutral” but not quite a line-break)
- Penetrative Plays (line-breaks)
My new figures were more reflective of what I had strongly suspected to have been closer to the truth. Now, instead of three players with identical figures, there was a huge difference.
My right half backs read 17 possessions – three turnovers, three mildly positive plays, one penetrative play and ten neutral plays. The left half back’s figures were pretty similar.
My midfielder’s figures read three turnovers while attempting to make a line-break, four mildly positive plays, nine penetrative plays and one neutral play.
Based off my new figures, I had an entirely different reading.
Whereas my half backs had turned the ball over three times each, purely through bad ball skills, my midfielder had attempted to break the line 16 times, had succeeded on nine occasions, partially succeeded on four and failed on three. The three turnovers were collateral damage amidst an impressive and match-dominating performance.
The bigger differentiating factor between my two half backs became apparent when I analysed which of my players were culpable for the key line-break in opposition scores. One had been breached for a goal and two points, while the other hadn’t been breached for any scores at all.
Now you had massively significant key performance indicators, between the two defenders in terms of their score concession figures and between the two of them and the midfielder in terms of what the respective players had done on the ball.

As the years have rolled on, I’ve become bluer and bluer in the face trying to explain to people that judging players’ performances based solely on scores, turnovers and “assists” is just too basic.
In fact, even using the most sophisticated of possession analysis as a complete “performance indicator” without looking at how many times the opposition have breached a player for scores and/or in general play, is equally senseless.
Hence I devised another advance on the system and began to align numerical figures to each element of the play:
- Neutral play – 1 point
- Mildly positive – 2 points
- Positive penetrative play – 6 points
- Point etc – 10 points
Equally, I give parallel negative values – minus six for a “Breach” or minus ten for culpability on a “Score Concession”, for example.
Is a midfielder’s performance , for example, really that good because he has scored a great goal, if he was taken on and beaten for three opposition points at the other end? Does one not cancel out the other?
Of course, the final number when all values are accumulated isn’t the “be all and end all”. You could spend an age arguing the pros and cons of giving certain values to certain elements. Also, there are nuances to football and hurling that the numbers don’t calculate.
However, the player’s numerical statistical tally certainly alludes to things, positive or negative, which can otherwise slip under the radar.
The point of it all, however, is that if you do a full “Possession Analysis” and a full “Breach Analysis” on a given game, whatever numerical values you give each piece of play, the final tally certainly paints a picture.
All-Stars
When I look at the All-Star selections from a few weeks ago, it’s difficult to make any other conclusion than that there is a complete lack of forensic analysis goes into the adjudication, which, frankly, makes a mockery of the whole thing.
Let’s forget about the fact that there’s no pre-stated system which gives particular weight to the national league relative to the championship or the latter rounds of championship relative to earlier rounds.
Let’s, however, look at the concept of taking every attacking and defensive piece of action of every player into account.
https://www.instagram.com/p/BbEcHyflJO3/?taken-by=sportsjoedotie
Unfortunately, as I worked with two separate counties in football and hurling in the latter stages of the championship last year, I’m not at liberty to go into greater detail. With the benefit of in-depth analysis on most of the teams at the latter stages, however, I can say without reservation that the whole thing is nothing short of a farce.
Amongst a plethora of unforensic decisions, most notably, calculating championship games against top ten sides in football and top eight in hurling, the defenders who have the stand-out figures both in terms of possession figures and lack of score concessions, from each code, were overlooked.
The omission of one created a stir, while one slipped completely under the radar. In fact, by my figures (based off detailed analysis of the three statistically top sides in each championship), the one who slipped under the radar was streets ahead as the best all-round defender, and possibly player, in his code for the year.
Justice for Tiernan McCann https://t.co/CG7rgWnBSc
— SportsJOE (@SportsJOEdotie) November 8, 2017
In each case, you’re looking at players who averaged a point or less per game in terms of score concession culpability, and giving weight to goals and points scored, had figures which were simply streets ahead of any other defender’s in the country in their respective codes.
They’ve been overlooked in favour of defenders whose score concession culpability runs into multiples of theirs, and possession tally figures barely reach half.
An equally obscene example came in 2016 when Kevin McManamon was rightly being mooted by many as a potential “Player of the Year” coming into the replayed final.
He was substituted in the 55th minute of the replay, apparently, after having a bad performance. In fact, he had scored a point and been fouled for three scored frees.
Working off my figures, on a minute per minute ratio, he had the highest statistical numerical tally of any Dublin forward that day. Some “experts” claimed this performance cost him an All-Star.
It’s just one of many obscene examples.
Close as they are to people’s hearts, at the end of the day, the All-Stars are only awards – awards I personally don’t take remotely seriously.
More significant is the fact that the same types of perceptions colour team selections up and down the country week in, week out.
With the right software, a full and in-depth “Possession Analysis” can be done in less than real time and a full “Breach/Score Concession Analysis” too.
Only when people start doing this as standard will they truly begin to see the hidden value in each player’s performances – and maybe then we can have All-Star awards that are worthy of being taken seriously.


